If marketers have learned anything by 2025, it’s this: data only matters if you can actually see it, understand it, and act on it.
That’s why marketing dashboards have become the control center of every high-performing, data-driven team.
Dashboards turn noise into clarity.
They take your KPIs, trends, conversions, and campaign data, and translate them into visuals that help you make decisions right now, not “next week when the report is ready.”
But here’s the catch: not all dashboards are useful. Some are cluttered with vanity metrics.
Others highlight the exact insights you need to increase performance and revenue.
This guide will walk you through how to build dashboards that actually work, the metrics that matter most, and the visualizations that turn raw data into strategy.
Want Dashboards That Turn Data Into Real Decisions?
Our analytics team designs custom dashboards aligned to your business goals.
Why Marketing Dashboards Matter in 2025
Marketing moves at real-time speed now, real-time customers, real-time interactions, real-time results. Waiting days for reports is no longer an option.
A strong dashboard helps you:
- Check performance instantly.
- Spot problems before they become expensive.
- Align every team around the same metrics.
- Track ROI across channels.
- Make smarter decisions faster.
But that only works if your dashboard is built with clarity, relevance, accuracy, and visuals that simplify your world instead of overwhelming it.
The Core Ingredients Of An Effective Dashboard
Every dashboard should answer one simple question:
“What do I need to know right now?”
Here’s what separates a high-performing dashboard from a confusing one.
1. The Right KPIs (And Not Too Many)
One of the biggest mistakes marketers make is tracking everything. Dashboards aren’t a warehouse; they’re a decision-making tool.
Stick to essential KPIs like:
- Traffic & acquisition.
- Conversion rate.
- Cost per acquisition (CPA).
- Revenue & ROI.
- Customer lifetime value (CLV).
- Channel performance.
- Engagement metrics.
The cleaner the dashboard, the faster you can act on it.
2. Real-Time Data Syncing
Static dashboards are outdated.
Modern dashboards pull in data automatically:
- Real-time.
- Across platforms.
- Using API connectors.
That means the insights you’re seeing match what customers are doing right now, not yesterday.
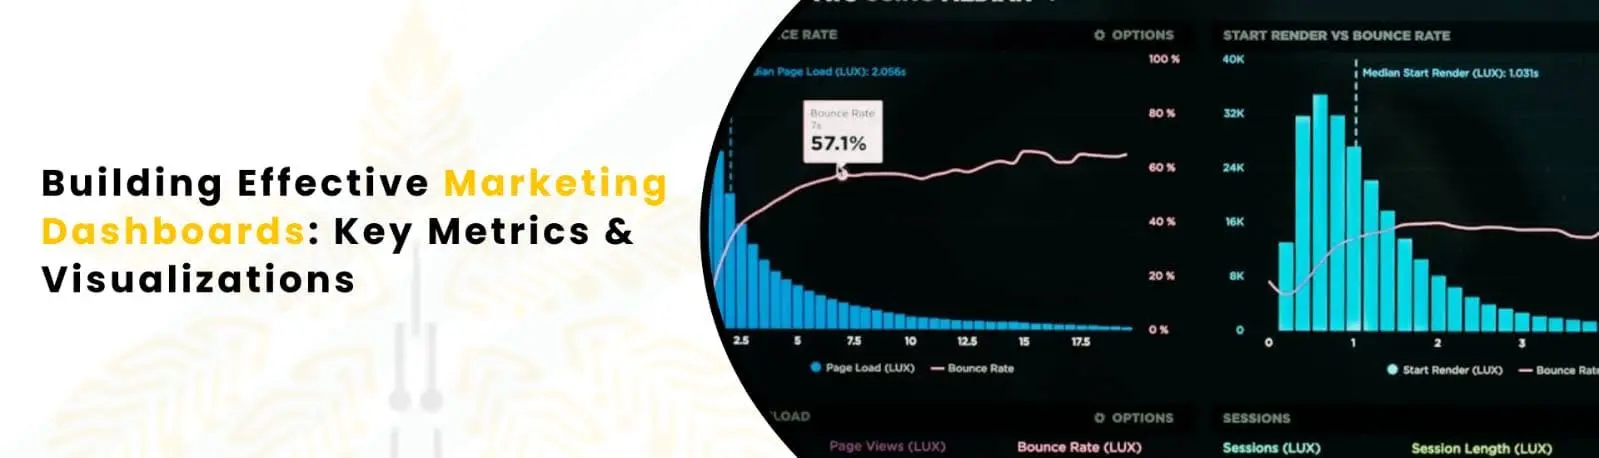
3. Clean, Simple Visualizations
This is where good data visualization becomes essential.
A strong dashboard uses visuals like:
- Line charts = show trends
- Pie charts = show distribution
- Funnels = show conversion flow
- Heatmaps = show engagement
- Bar charts = show comparisons
If a visualization requires a long explanation, it’s the wrong visualization.
4. Storytelling, Not Just Data Storage
A dashboard shouldn’t just present data; it should reveal what the data means.
Examples of data turned into a story:
- Traffic is rising = conversions are dropping = landing page needs work
- Email open rates are high = clicks are low = message mismatch
- Ads get clicks = ROAS is weak = audience targeting is off
When your dashboard helps you find the “why,” that’s when it becomes powerful.
Not Sure Which KPIs Matter Most For Your Brand?
We’ll build a clean, powerful framework your whole team can follow.
Types Of Marketing Dashboards To Build
Different roles need different insights.
Here are the core dashboard types every team should have:
1. CMO Dashboard
Highlights:
- Revenue
- ROI
- Budget allocation
- Top-performing channels
- Pipeline growth
This is the executive-level snapshot of performance.
2. Performance Marketing Dashboard
Tracks metrics like:
- CPA
- CTR
- CPC
- ROAS
- Conversion rates
- Spend efficiency
Ideal for paid ads, PPC, Meta, YouTube, and Google campaigns.
Want a stronger grip on online marketing? See our Digital Marketing Services.
3. Content Marketing Dashboard
Shows:
- Organic traffic
- Keyword rankings
- Engagement metrics
- Top-performing pages
- Content-driven conversions
Essential for SEO, blog teams, and content strategists.
Curious about how to improve your content? Explore our Content Marketing Services.
4. Social Media Dashboard
Includes:
- Follower growth
- Reach
- Engagement rate
- Best posting times
- Campaign performance
Great for brands heavily active across social platforms.
Marketing dashboards sit inside a bigger data-driven ecosystem. To build dashboards that truly support your strategy, check out these related guides:
- Leveraging Analytics to Boost ROI in 2026
- Mastering Google Analytics 4
- Which Model Is Right for Your Business?
- Predictive Analytics to Anticipate Customer Behavior
Together, they help you build an end-to-end analytics framework.
Ready To Scale With True Data Clarity?
We create high-end digital experiences that reflect your brand’s elegance and innovation. Let’s craft something extraordinary together.
FAQs
What is a marketing dashboard?
A visual system that displays your key marketing metrics in real time so you can track performance quickly and accurately.
Which metrics should I include?
Focus on conversion rate, CPA, revenue, ROAS, traffic, engagement, and core KPIs that align with your goals.
What tools can I use to build dashboards?
Looker Studio, Power BI, Tableau, HubSpot dashboards, Shopify analytics, GA4, Supermetrics, and similar tools.
Do dashboards really improve ROI?
Yes, they help you make faster, smarter decisions based on data rather than assumptions.
How often should dashboards update?
Ideally, in real time, but daily updates can work for slower-paced campaigns.